Discover the hidden revenue potential
in your workshop
Workshops achieve an average of 8.85% more turnover with WESP
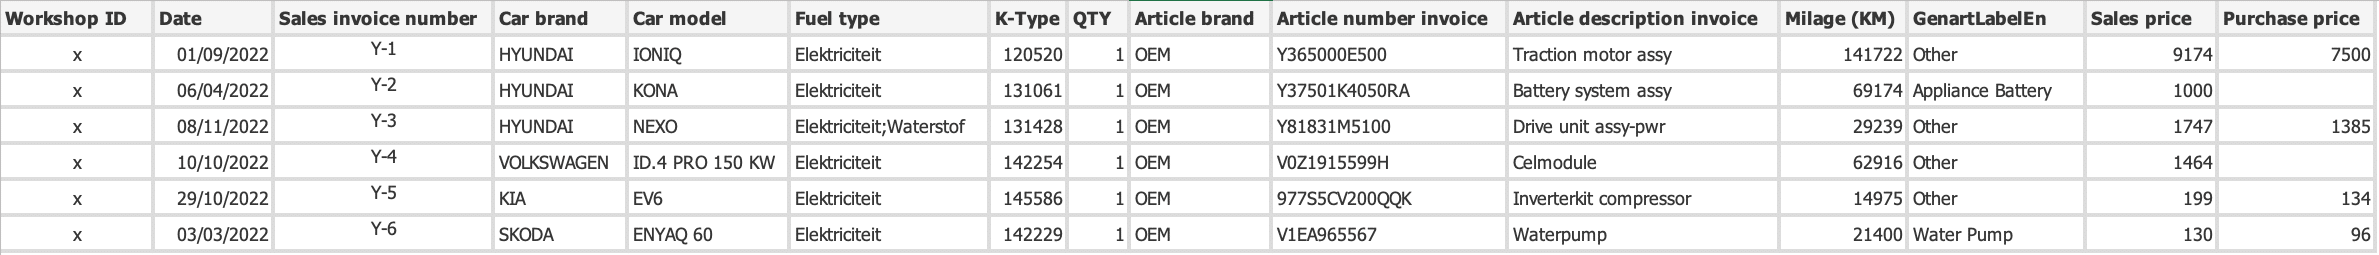
We make visible what valuable information lies hidden in your data and how you can use it for better decisions.
Common questions from workshop owners
Technician productivity
How many hours do I sell per technician? Is this in line with market standards?
Customer value
How many customers do I have and what is the turnover per customer? Is this increasing or decreasing?
Margins & price comparison
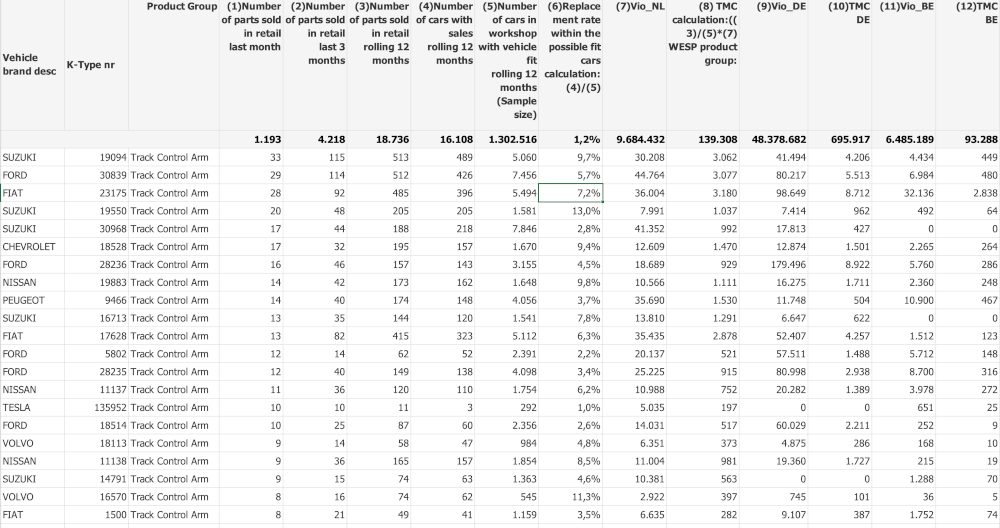
How are margins developing per product group and how do my prices compare to the market?
The WESP Workshop Performance Dashboard turns your workshop data into valuable strategic insights!
The WESP Workshop Performance Dashboard (WPD) shows the development of your turnover groups from the past five years and compares your performance with market averages. This way you immediately discover where your improvement potential lies.
All important KPIs at a glance
Get immediate insights into your workshop's performance
Comprehensive workshop analysis
With the WESP Spider diagram you can see at a glance where your workshop excels and where opportunities still lie.
How WESP gives you insights to improve your daily performance
Practical benefits for Auto Garage Network customers
What does WESP deliver to you?
Weekly and monthly clear analysis of your workshop occupancy and productivity
All important KPIs clearly presented by your personal consultant
Concrete recommendations to improve your workshop processes
Compare your performance with market averages; how does your business perform compared to the rest of the market?
Increase quality
By using data insights to advise on necessary and prescribed maintenance we increase quality and customer loyalty.
Technician efficiency
Optimise workshop scheduling and increase productivity by deploying technicians in a targeted and efficient manner.
Increase turnover
Use data insights to realise additional sales and increase the average order value.
Success stories from our customers
Read how other workshops have improved their results with WESP
Thanks to WESP we make optimal use of our workshop data. The weekly reports have clearly increased our productivity.
WESP has given us insight into the most important KPIs of our workshop. This has resulted in a significant improvement in our workshop efficiency.
With the detailed analyses from WESP we have been able to significantly optimise our processes. A valuable tool for every modern workshop.
Satisfied workshops
Avg. turnover increase
Optimised KPIs
These companies already trust us


How does the process work?
From an initial analysis to structural improvement of your workshop
Introduction
You receive a non-binding presentation with a sample report
Data protection
We ensure a secure connection with your workshop system (GDPR compliant)
Initial Analysis
We compare your results with market data and map your potential
Decision
You decide whether you want to continue working with WESP to improve your results
The Initial Analysis is free of charge and completely non-binding
One-time connection with our systems
Starten Sie noch heute — ohne Risiko und Verpflichtung
Probeanalyse anfordern
Buchen Sie jetzt ein Einführungsgespräch und erfahren Sie, was WESP für Ihre Werkstatt tun kann.