Deep dive data technology with WESP data analysis

Independent research has shown that workshops using data analysis by WESP have on average an 8.9% greater yearly revenue than workshops that do not make use of their services. WESP allowed research to be carried out using the combined data from 593 workshops in the Netherlands and Germany. Alongside a higher total net revenue, increases in total customers and revenue from individual parts were seen. This not only benefits workshops but also other parties within the value chain.
The impact of Business Intelligence on aftersales performance
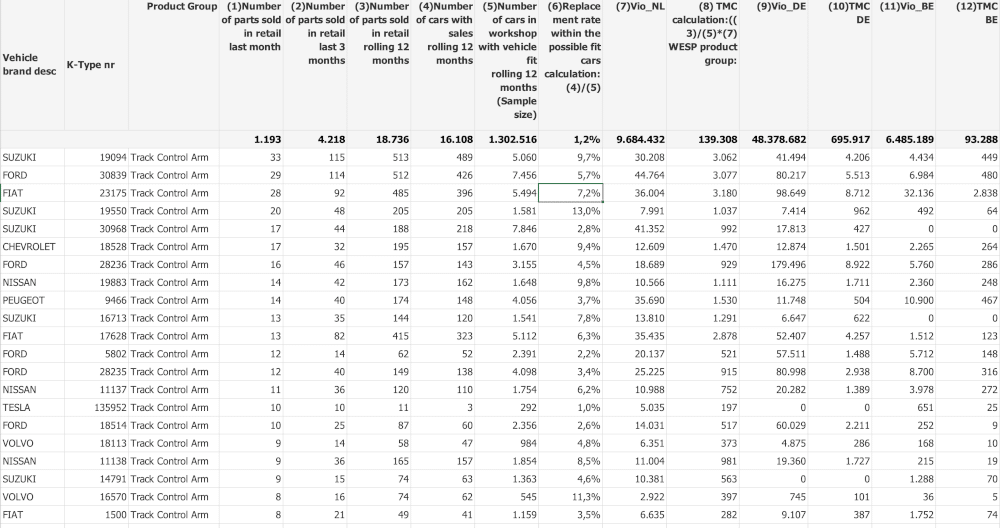
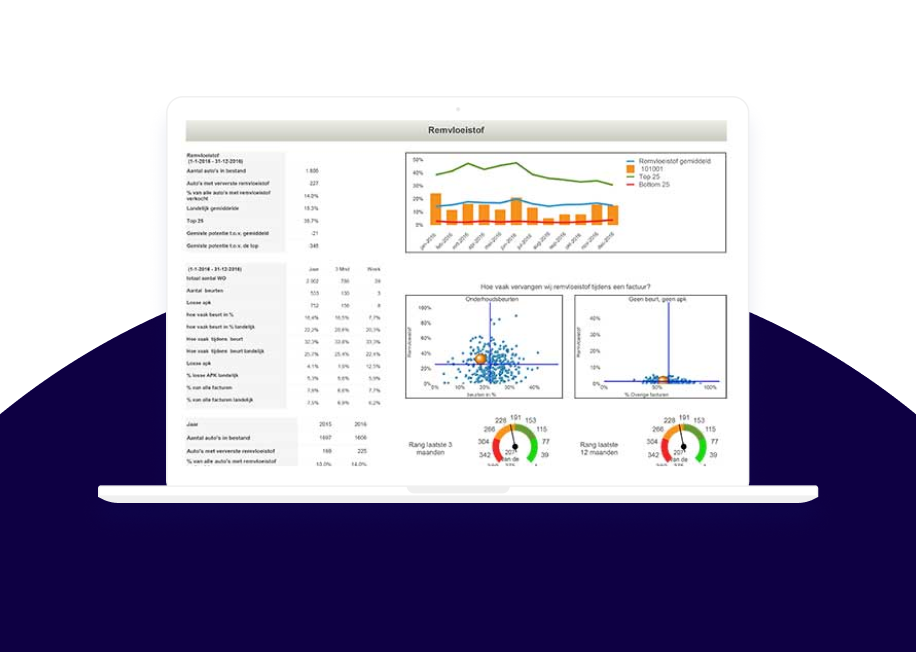
The research investigated the impact of the use of data, also known as Business Intelligence, on aftersales performance. Long-term impact was also measured. The dataset was provided by WESP. Since 2012, using its Workshop Dashboard (WPD) WESP has supported its customers in optimising their business operations. Through capturing, combining and comparing (benchmarking) data from individual workshops, growth potential can be determined. Reports and personal advice provide insights which allow workshops to act and optimise performance. For example, a workshop may uncover that they do not offer windscreen wipers frequently enough during servicing, when compared to the benchmark.
The research used the combined data of 593 different workshops in the Netherlands and Germany. These are general automotive workshops that use the Workshop Dashboard or have used it in the period between 2012 and 2017.
Growth in parts revenue, total customers and total revenue
The results from the research show that the use of the Workshop Dashboard impacts workshops positively by increasing net revenue by 8.9%. This equates to an average actual revenue increase of €53.751 for individual workshops. The results are calculated based on revenue measured in the 3 years prior to using the dashboard and 3 years after. A multilevel linear regression model was the chosen statistical method to determine the connection between use and time. Furthermore, consideration was given to the influence the location of the workshop may have and workshops’ formulas for generating revenue.

Revenue growth within a universal workshop can be explained by two factors: the efficiency of employees and sales of parts. Therefore, the impact on total customers (total cars) and the total parts sold were investigated. Illustrated in the following two diagrams, the results show that both exhibit continuous growth during use of the Workshop Dashboard. The clear improved performance is evident in users of the Workshop Dashboard, whereas for non-users the opposite can be seen. For users of the dashboard, the total number of customers increased by 9.1% and parts revenue increased by 5.6%.
Figure 2: average total cars (based on unique license plates) per quarter, for workshops using the BI tool and workshops that do not.


It is interesting to note that the results of this research show not only positive outcomes for workshops but also produce benefits for other parties in the aftersales value chain. Wholesalers, importers of car parts and manufacturers of car parts also benefit from the insights into sales of parts. WESP therefore, also sees BI as a practical advisory tool for all parties in the value chain. Besides the Workshop Dashboard, WESP offers its Parts Performance Dashboard with information specific to these parties. This leads to a growth in revenue growth across the whole value chain.
Would you like to receive more information regarding the research, the applicability of BI within your business or information about the Workshop Dashboard? Contact WESP immediately.


